10 Best Ping Sweep Tools for Finding Devices on Your Network
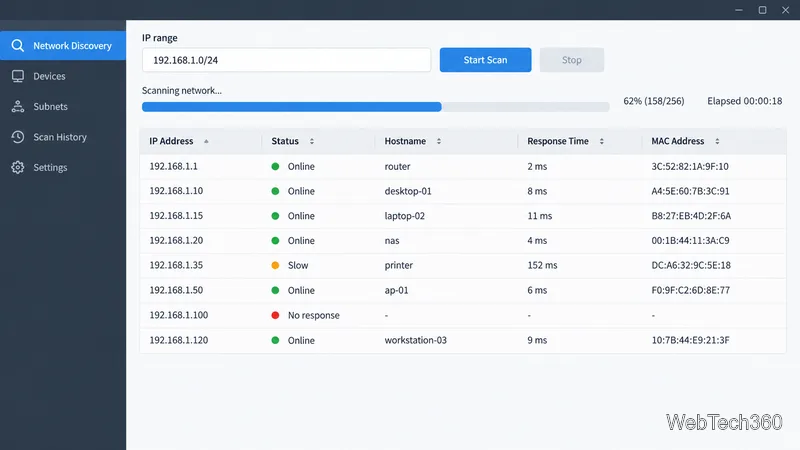
Compare 10 ping sweep tools for quick LAN discovery, cross-platform scanning, and IP address management. Learn what a sweep can—and can’t—tell you.
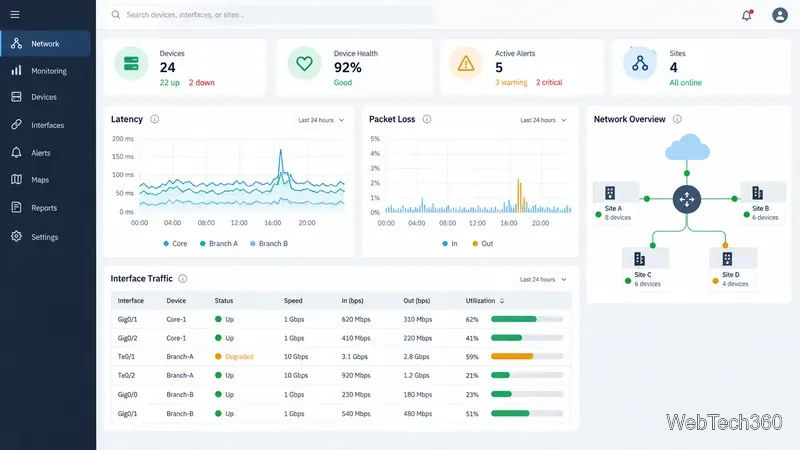
Effective network monitoring starts with a verified inventory, service-focused metrics, and actionable alerts. Map critical devices and services, establish normal performance, then choose a platform that supports your infrastructure and can be maintained by your team. This helps surface developing issues without turning every brief fluctuation into a page.
Network monitoring tracks whether devices and services are reachable and how they perform over time. It commonly covers device and interface status, traffic, server resources, and service checks. Security logging has a different job: an NMS explains availability and performance, while centralized logs or a SIEM help investigate events such as suspicious logins and configuration changes. Many teams use both. NIST frames continuous monitoring as ongoing awareness for risk decisions; review network coverage as the environment changes.
List routers, switches, firewalls, wireless equipment, critical servers, cloud links, and customer-facing services. For each, record location, owner, business priority, management address, and dependencies. Use discovery to seed the inventory, then verify it and add devices that cannot be found automatically. Group by site or service. Update the list after changes so coverage stays complete.
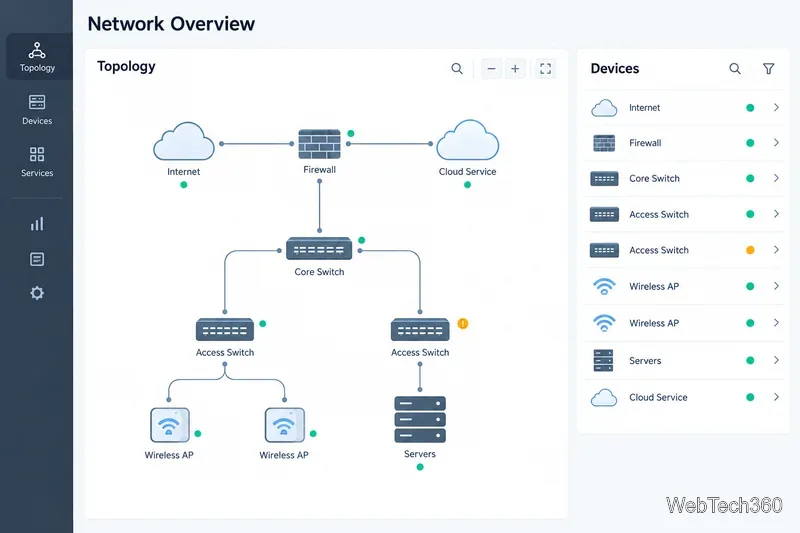
Start with a compact set of measurements tied to critical services:
Set baselines by site and service instead of using one universal threshold. Compare current behavior with normal busy periods and watch for sustained pressure or sudden changes.
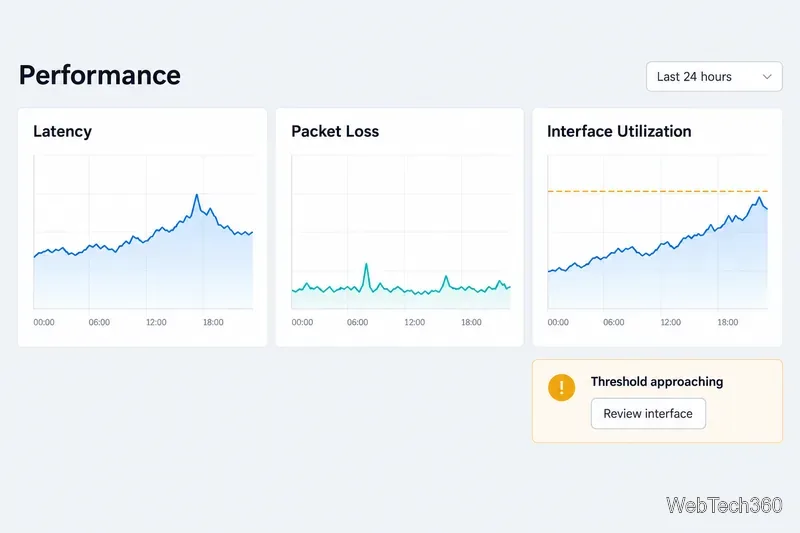
Alert on conditions that require action: outages, failed service checks, or sustained threshold breaches. Use a delay or recovery rule to filter transient blips. Include the device or interface, affected service or site, first-seen time, observed and expected values, and a runbook. Route alerts to an owner and define escalation.
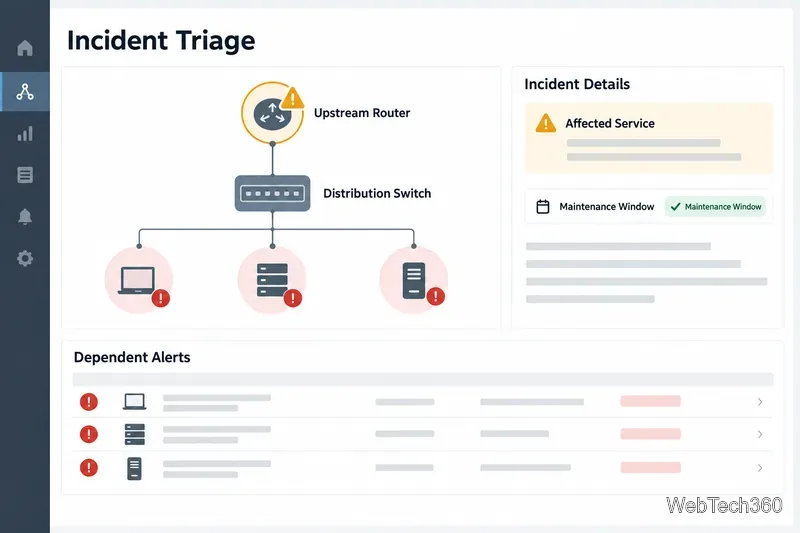
Group downstream alerts when an upstream failure explains them; schedule maintenance windows for planned work. This helps responders find likely causes faster. Review suppression rules after topology changes so independent failures stay visible.
Monitoring credentials and logs can reveal sensitive infrastructure. Restrict management traffic, use read-only accounts where possible, grant role-based access, and secure the monitoring server and backups. Prefer SNMPv3 when supported, with compatible authentication and privacy settings; the SNMPv3 User-based Security Model defines these security services. Follow CISA guidance for protecting logs, and never expose management interfaces directly to the public internet.
Confirm probes reach devices from relevant locations, credentials work, and history is retained for troubleshooting and capacity planning. Test alerts with their recipients; document owners and maintenance schedules. Review stale devices, gaps, and noisy rules after network changes. Keep a tested recovery plan for the monitoring platform.
These products cover common needs. Fit depends on your environment, deployment model, licensing, and available skills. Verify plans and device support with each vendor.
| Tool | Where it may fit | Check during evaluation |
|---|---|---|
| SolarWinds Network Performance Monitor | Multi-vendor environments needing device metrics, maps, alerting, reporting, or path troubleshooting. The vendor lists availability, latency, packet loss, utilization, and device health. | Check device and protocol support, deployment, retention, and needed modules. See SolarWinds NPM. |
| Paessler PRTG Network Monitor | Teams monitoring devices, traffic, servers, and services with maps, dashboards, and notifications. PRTG represents monitored values as sensors. | Estimate sensor and probe needs for your coverage plan. See Paessler PRTG. |
| ManageEngine OpManager | Organizations seeking discovery and performance monitoring across network devices and servers. The docs describe SNMP, CLI, and WMI support. | Check protocol access, templates, role controls, add-ons, and remote-site management. See OpManager. |
Pilot a representative site, critical service, and mix of devices. Test discovery, metric accuracy, alerts, maintenance handling, reports, permissions, and recovery. Ask dashboard users what context is missing. A short pilot shows whether the platform fits your network better than a feature checklist.
Compare 10 ping sweep tools for quick LAN discovery, cross-platform scanning, and IP address management. Learn what a sweep can—and can’t—tell you.
Compare six network management tools for performance monitoring, including SNMP coverage, mapping, alerts, deployment models, and cost tradeoffs.
Compare Wi-Fi analyzer picks for Windows, iPhone, and Android, including tools for channel congestion, signal coverage, heat maps, and network troubleshooting.
Compare seven free, open-source ping monitors, from full network suites to focused latency probes, and choose the right fit for availability, packet loss, and history.
Learn what QoS means in networking, how DSCP markings and traffic queues prioritize voice, video, and business applications, and what QoS cannot fix.
Compare reliable SFTP server software for Windows and Linux, including OpenSSH, Bitvise, SolarWinds, and SFTPGo. Find the right fit for your security and file-transfer needs.
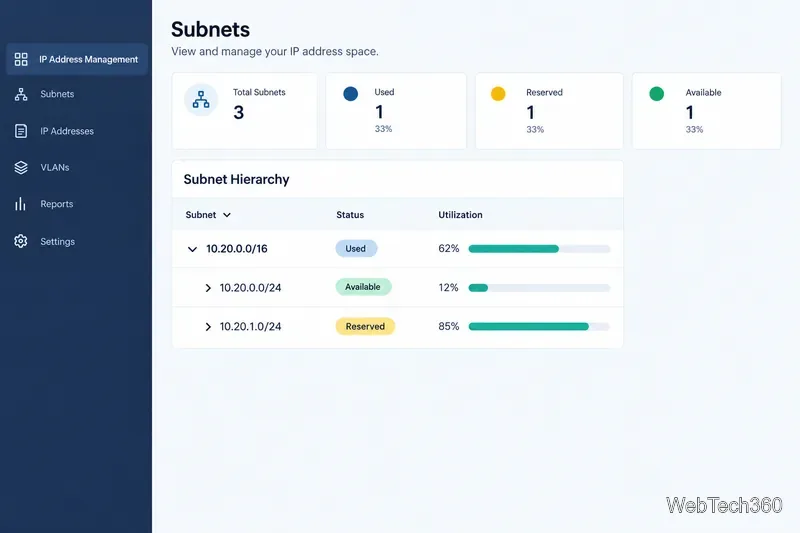
Compare seven IP address manager tools for subnet discovery, DNS and DHCP coordination, network inventory, and open-source IPAM.
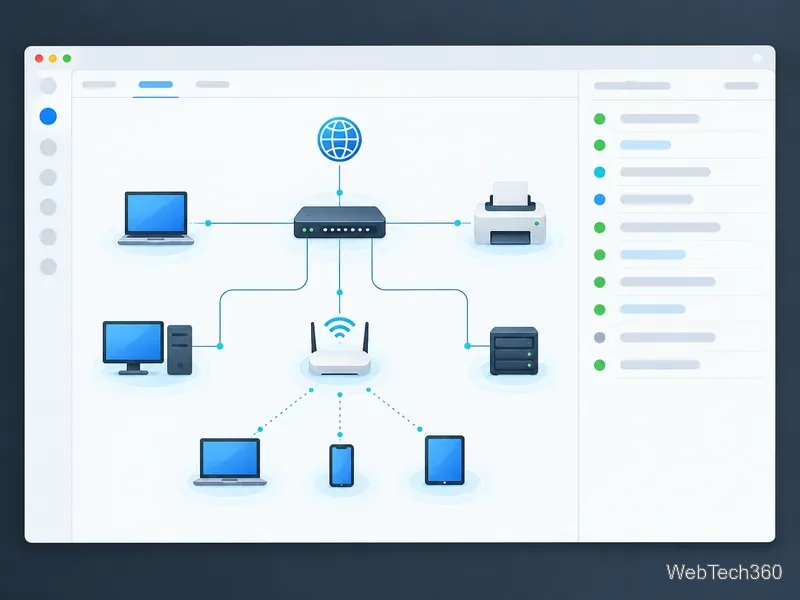
Build practical network monitoring with clear device coverage, useful performance metrics, actionable alerts, and a comparison of SolarWinds NPM, PRTG, and OpManager.
Compare network scanner tools for quick device discovery, cross-platform IP scans, and enterprise IPAM, with guidance on matching each option to your network.
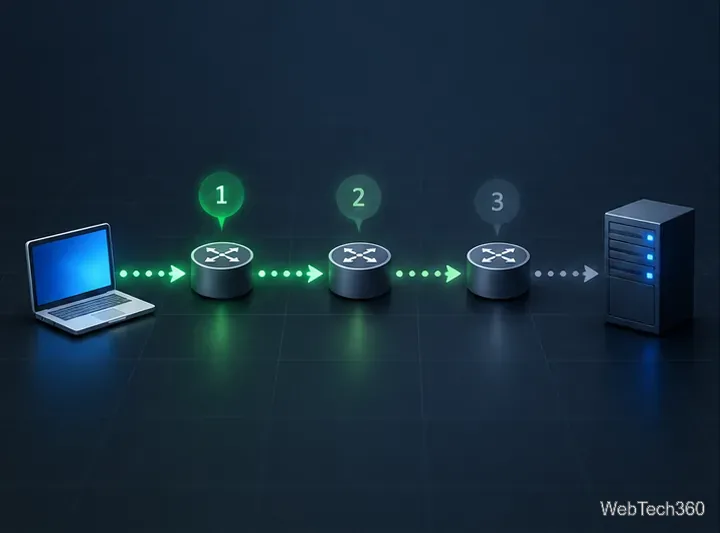
Use Nmap’s --traceroute option to map hops to an authorized host, understand hop and RTT output, and troubleshoot missing responses without over-scanning.