Home
» WEB
»
How to View and Save a Browser Console Log
How to View and Save a Browser Console Log
When a website displays an error, a button does nothing, or a page behaves unexpectedly, the browser Console can reveal JavaScript errors, warnings, and some network-related messages. In Chrome and other Chromium-based browsers, you can review these messages in DevTools and save them as a plain-text .log file to share with a support team. The Console is not a complete record of every request and response; use the Network panel when you need detailed request headers, response bodies, or timing information.
1. Open the browser Console
Open the page where the problem occurs.
Open Developer Tools. In Chrome on Windows or Linux, press F12 or Ctrl+Shift+I. On macOS, press Command+Option+I. You can also open the browser menu and choose More tools > Developer tools.
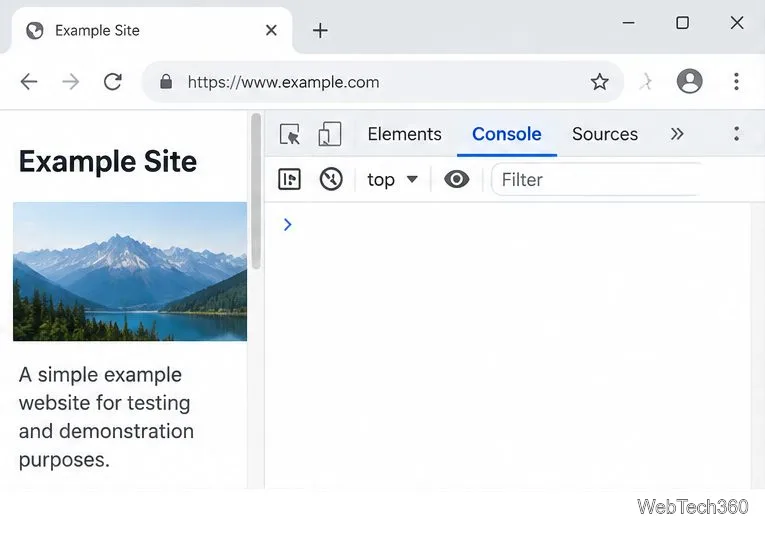
Select the Console tab. If DevTools opens in a side or bottom panel, you can leave it there or use the DevTools menu to change its docking position.
Open DevTools on the page you want to troubleshoot, then select Console.
Microsoft Edge uses a similar workflow. Open DevTools with F12 or Ctrl+Shift+I on Windows, then select Console. Keyboard shortcuts can vary with browser, operating system, and keyboard settings; the browser menu is a reliable alternative.
2. Reproduce the issue and keep the right messages
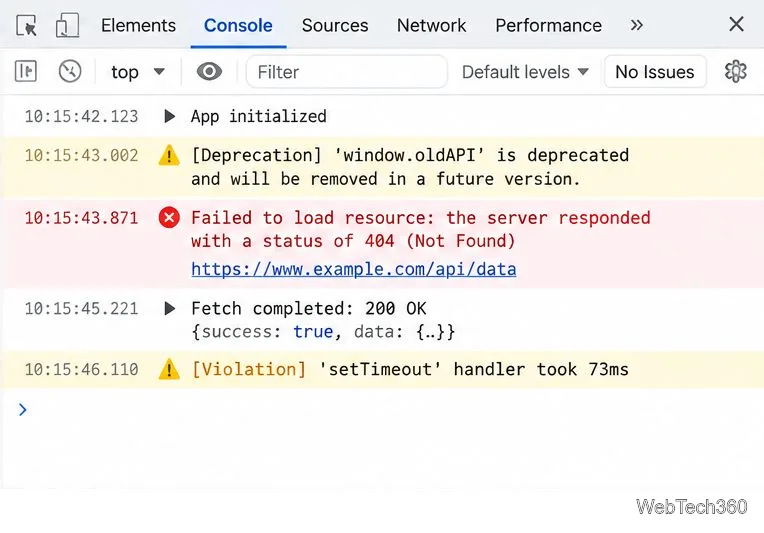
With the Console visible, repeat the action that triggers the problem: submit the form, click the affected button, sign in, or reload the page. Look for red error messages and yellow warnings. Expand an entry when you need its stack trace or additional details. Use the Console filter or message-level controls to narrow the display, but remove filters before saving if you need the complete visible log.
Console entries can show JavaScript errors, warnings, and certain failed resource loads.
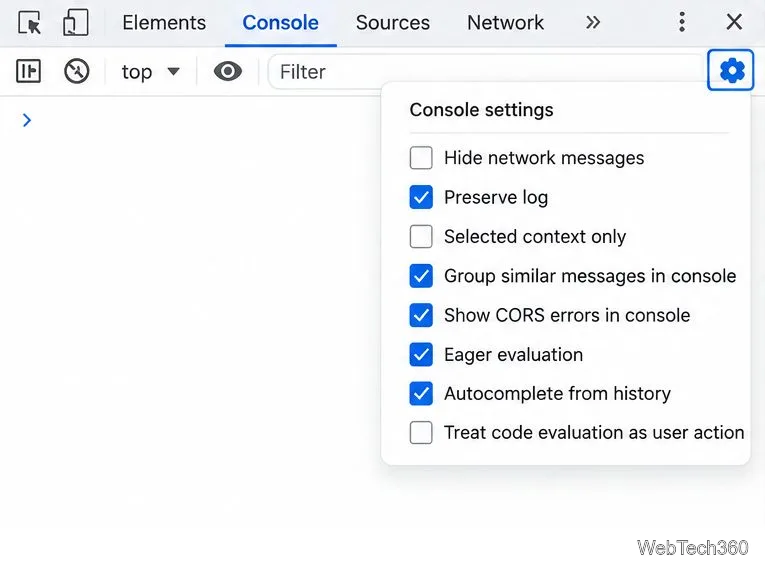
Keep logs across navigation: a normal page navigation can clear the Console. In Chrome, open Console settings and enable Preserve log before reproducing the issue. Edge offers a similar Preserve log setting. This is especially useful when a click redirects to another page or the failure occurs during a reload.
Enable Preserve log before reproducing problems that cause navigation or reloads.
If you specifically need to see XMLHttpRequest and Fetch activity in the Console, Chrome DevTools provides a Log XMLHttpRequests setting. This adds those requests as they occur, but it is not a substitute for the Network panel, which provides more complete request-level inspection.
3. Save the Console output to a file
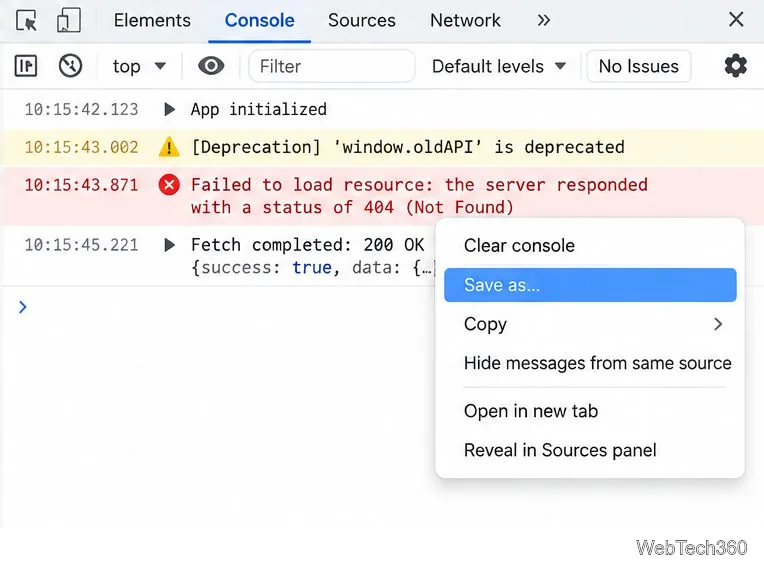
After reproducing the issue, right-click an empty area or a message inside the Console.
Choose Save as… (the wording may vary slightly by browser version).
Choose a folder and filename, then save the log.
Open the resulting .log file in a text editor such as Notepad, or attach it to your support request if requested.
Use Save as to export the current Console messages as a plain-text log.
In Chrome, the Console context menu also includes Copy or Copy console in supported versions, which can be useful for a short excerpt. Saving is usually better for longer output. The exported file contains the messages currently available in the Console, not a full archive of all browser traffic or necessarily the history of commands you typed.
4. When the problem involves network requests
Console output is helpful for JavaScript exceptions and some failed loads, but it may not explain why an API call failed. Open the Network tab in DevTools, reproduce the problem, and select the relevant request to inspect its status code, request and response headers, payload, and timing. If a support team asks for a network capture, use the Network panel’s export option to save a HAR file, and follow the team’s instructions about whether sensitive data should be included. HAR files may contain cookies, authorization headers, URLs, or submitted form data, so review and sanitize the file before sharing it.
Troubleshooting tips
The Console is empty: reproduce the issue after opening DevTools, check that message levels are not filtered out, and reload if appropriate.
Messages disappear after clicking a link: enable Preserve log first, then repeat the steps.
You see a 404 or another network error: inspect the corresponding request in Network; the Console message alone may not show the full response.
The issue happens only in one browser: collect a separate log in each browser and record the browser version, operating system, page URL, and exact steps to reproduce.
The saved file seems incomplete: confirm the Console was not filtered and that the problem was reproduced after logging was enabled. If you need lower-level connection diagnostics, ask support which capture format they require rather than assuming a Console log contains all network data.