10 Best Ping Sweep Tools for Finding Devices on Your Network
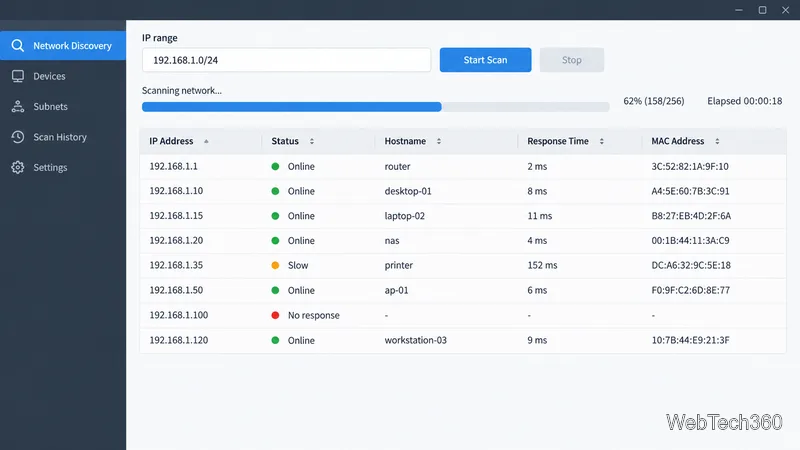
Compare 10 ping sweep tools for quick LAN discovery, cross-platform scanning, and IP address management. Learn what a sweep can—and can’t—tell you.
For a Windows environment, the right monitoring tool should show more than whether a server responds to ping. It should surface resource pressure, failed services, application trouble, and actionable alerts. Six strong options are SolarWinds Server & Application Monitor (SAM), ManageEngine OpManager, Paessler PRTG, Zabbix, Checkmk, and Datadog Infrastructure Monitoring. Compare how they collect data and how they are licensed before choosing.
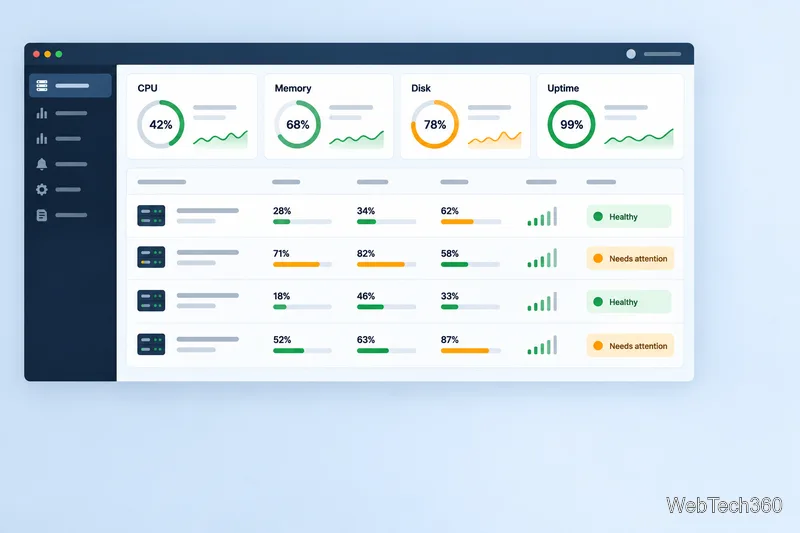
Track host availability and performance (CPU, memory, disk, and network), Windows services and event logs, and application health for workloads such as IIS, SQL Server, or Active Directory. A server may respond to ping while a critical service is stopped, so uptime alone is not enough.
Agentless WMI or WinRM checks reduce software to install but depend on working credentials, firewall access, and Windows management services. Agents can expose additional host data, but they add software to deploy, update, and secure. Choose a collection model that fits your network rules and operations team.
| Tool | Best fit |
|---|---|
| SolarWinds SAM | Server and application health in one view |
| ManageEngine OpManager | Servers and network devices together |
| PRTG Network Monitor | Sensor-based infrastructure monitoring |
| Zabbix | Self-managed, customizable monitoring |
| Checkmk | Agent-based, cross-platform monitoring |
| Datadog Infrastructure Monitoring | Hosted monitoring for hybrid stacks |
SolarWinds SAM links server symptoms with application health. Templates cover Microsoft workloads such as IIS, SQL Server, Exchange, and Active Directory. Use SAM as a standalone Orion module or as part of SolarWinds Observability Self-Hosted.
It suits teams that need application context and troubleshooting views. Current licensing is subscription-based and scales by monitored nodes; pricing is quote-based. Confirm which platform components your team needs before comparing it with a narrower server monitor.
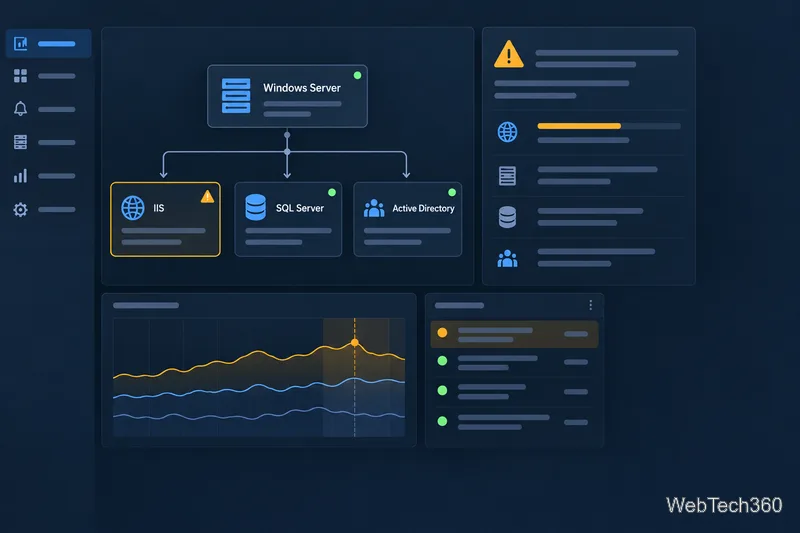
ManageEngine OpManager combines server and network monitoring. It tracks uptime, CPU, memory, processes, services, and disk space, with agent-based and agentless options.
For Windows, it uses WMI; ManageEngine also documents WinRM as a transport when DCOM/RPC ports are restricted. You still need to plan credentials and firewall rules, so test connectivity before onboarding many servers. OpManager fits teams that want server and network health in a shared console.
PRTG Network Monitor uses WMI, SNMP, and PowerShell to monitor Windows Server metrics, performance counters, services, and applications. Its sensor model makes it straightforward to select individual measurements and build one view across servers and network devices.
After its 30-day trial, PRTG Network Monitor has a freeware edition capped at 100 sensors; paid licenses scale by sensor count. One sensor tracks one measured aspect, so many checks can use the allowance quickly. Check Paessler’s current license details.
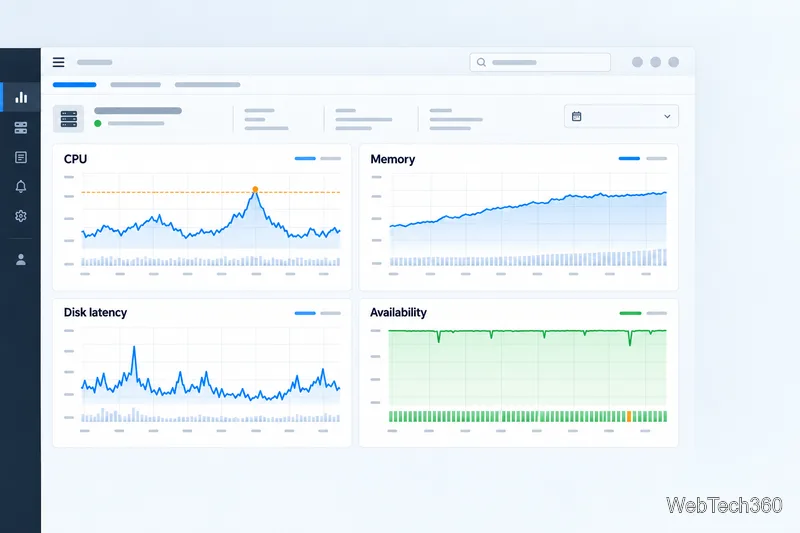
Zabbix is an open-source monitoring platform with no software license fee. Windows monitoring uses an agent that runs as a Windows service, configured against a Zabbix server and frontend. Its official guide covers basic metrics and alerts.
Zabbix fits teams that want control over templates, triggers, and deployment. The tradeoff is ownership: you maintain the server, database, upgrades, agents, alert rules, and data retention. See the Windows monitoring guide to estimate setup work.
Checkmk for Windows uses an agent to report CPU, memory, disk, services, processes, network interfaces, and filesystems. It is worth considering when you monitor Windows alongside Linux and want a common service-discovery workflow.
Install the agent as an MSI package and register it with Checkmk; the current Agent Controller supports encrypted TLS after registration. Community and commercial editions are available, so compare their feature limits and scale. The Windows agent guide explains deployment.
Datadog Infrastructure Monitoring is a hosted option for teams already using Datadog or monitoring Windows alongside cloud and container workloads. Its Windows Agent collects host metrics; integrations can add Windows service and event-log checks. Agent installation requires a Datadog API key.
The hosted model avoids running the central platform yourself, but it adds an agent and sends telemetry to Datadog. Commercial plans use host-based pricing, which varies by plan and commitment. Estimate cost using host count and any logs or additional products you need, and review the Windows Agent documentation and current pricing.
Pilot two or three options on the same representative servers. The best fit is the one that gives your team clear signals and useful application context without adding more maintenance or cost than the environment can support.
Compare 10 ping sweep tools for quick LAN discovery, cross-platform scanning, and IP address management. Learn what a sweep can—and can’t—tell you.
Compare six network management tools for performance monitoring, including SNMP coverage, mapping, alerts, deployment models, and cost tradeoffs.
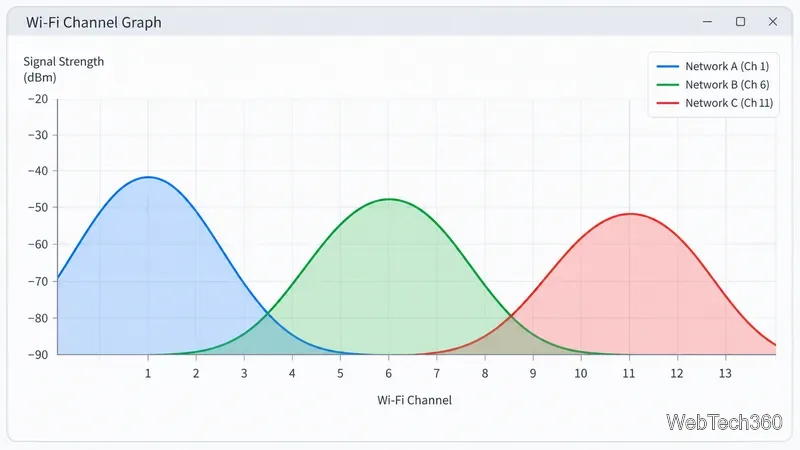
Compare Wi-Fi analyzer picks for Windows, iPhone, and Android, including tools for channel congestion, signal coverage, heat maps, and network troubleshooting.
Compare seven free, open-source ping monitors, from full network suites to focused latency probes, and choose the right fit for availability, packet loss, and history.
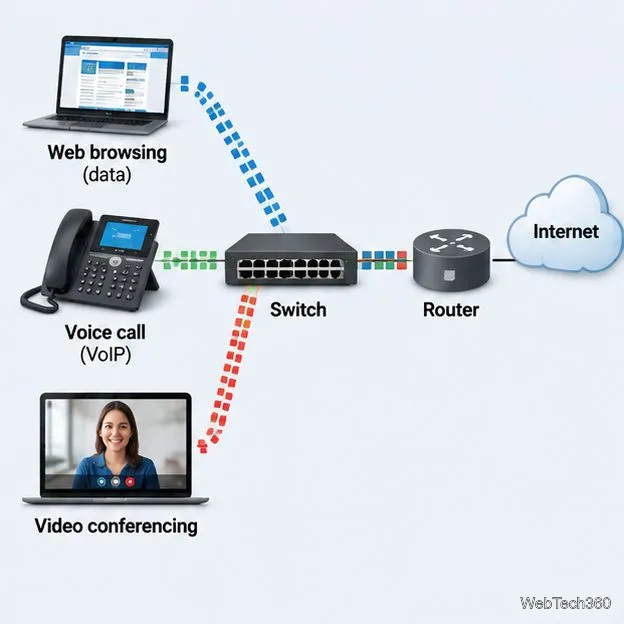
Learn what QoS means in networking, how DSCP markings and traffic queues prioritize voice, video, and business applications, and what QoS cannot fix.
Compare reliable SFTP server software for Windows and Linux, including OpenSSH, Bitvise, SolarWinds, and SFTPGo. Find the right fit for your security and file-transfer needs.
Compare seven IP address manager tools for subnet discovery, DNS and DHCP coordination, network inventory, and open-source IPAM.
Build practical network monitoring with clear device coverage, useful performance metrics, actionable alerts, and a comparison of SolarWinds NPM, PRTG, and OpManager.
Compare network scanner tools for quick device discovery, cross-platform IP scans, and enterprise IPAM, with guidance on matching each option to your network.
Use Nmap’s --traceroute option to map hops to an authorized host, understand hop and RTT output, and troubleshoot missing responses without over-scanning.