10 Best Ping Sweep Tools for Finding Devices on Your Network
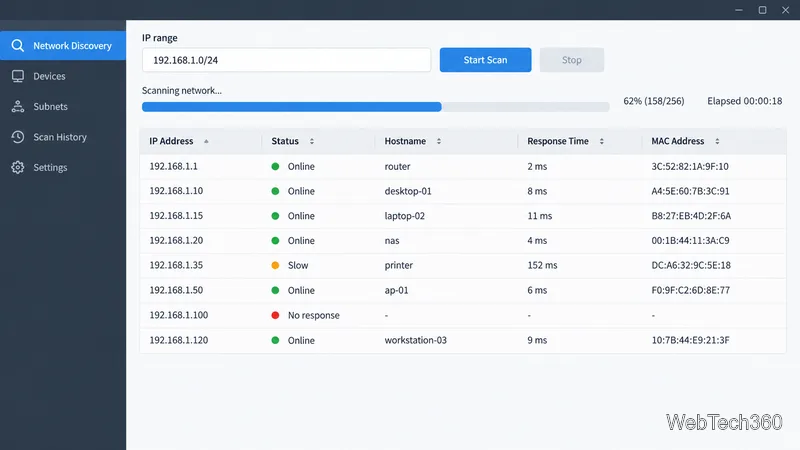
Compare 10 ping sweep tools for quick LAN discovery, cross-platform scanning, and IP address management. Learn what a sweep can—and can’t—tell you.
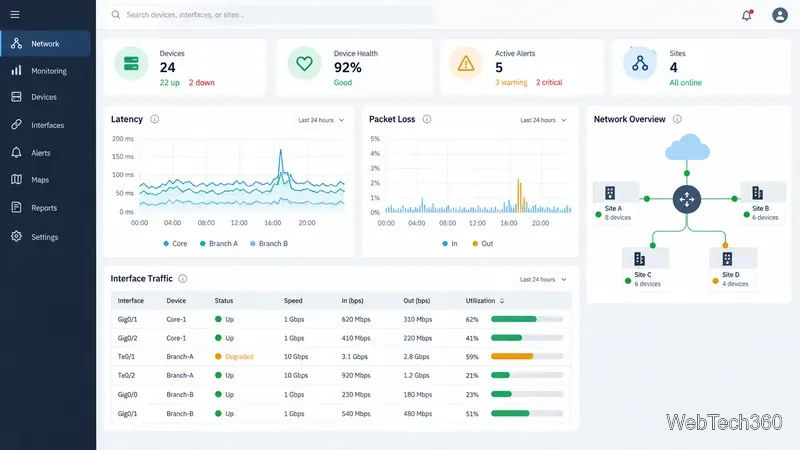
Choosing a Linux network monitoring tool starts with the question you need answered. For multi-vendor switches and routers, look at LibreNMS or Zabbix. Prometheus with SNMP Exporter fits a custom metrics pipeline; Cacti emphasizes graphs; Nagios Core uses plugins for service checks; Netdata gives detailed Linux host metrics.
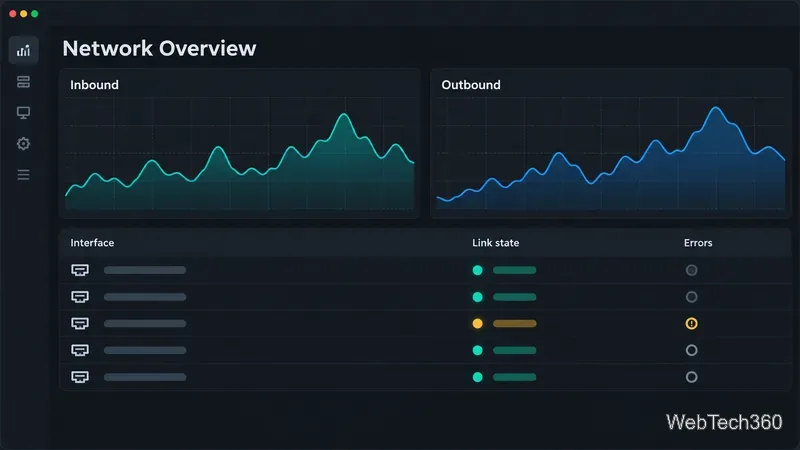
Monitoring may cover network devices, Linux hosts, or traffic flows. SNMP is common for switches and routers; agents and exporters collect host metrics. NetFlow, sFlow, and IPFIX can identify traffic sources and conversations, while interface counters report volume only.
SNMP interface byte counters are cumulative. Subtract the earlier value from the current one, multiply by eight, and divide by elapsed seconds for an estimated bit rate. This is an average across the polling interval, so bursts can be smoothed out; shorter intervals add detail and also increase polling and storage work.
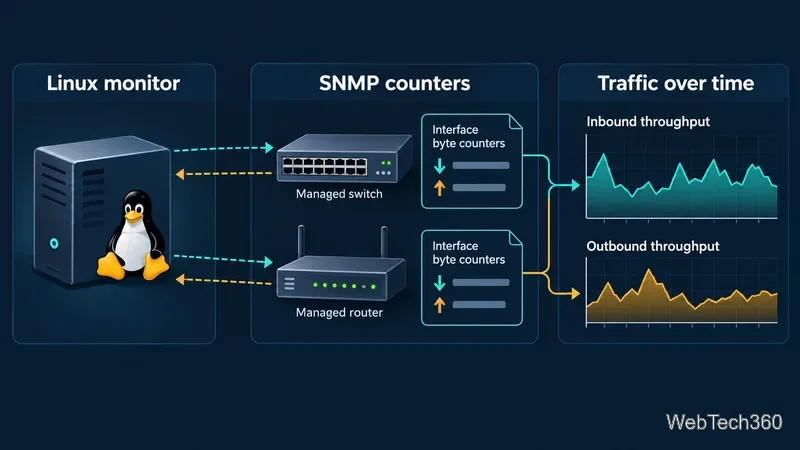
SNMP versions 1 and 2c send community strings without encryption. Where supported, use SNMPv3 with authentication and privacy, and restrict polling to the monitoring network. See the SNMP Exporter documentation and the IETF SNMPv3 security specification.
The tools overlap, but differ in device coverage, detail, and setup effort.
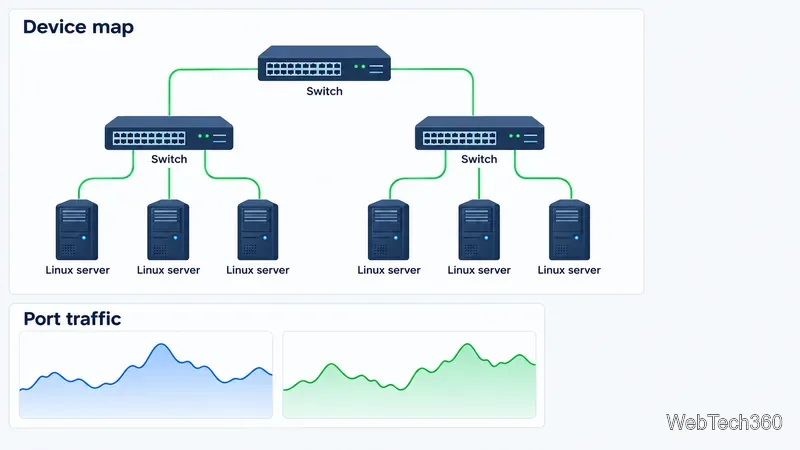
LibreNMS focuses on network hardware, with automatic discovery, alerts, device and port metrics, and distributed polling. It is a good starting point for multi-vendor switches and routers. Check its feature list and discovery guide for your devices; discovery needs reachable hardware and working SNMP credentials.
Zabbix combines SNMP device monitoring with agent-based checks for Linux servers, applications, and services. Templates, discovery rules, triggers, and dashboards make it broad, though setup takes planning. Review its SNMP guide and network discovery documentation.
Prometheus scrapes time-series metrics from exporters. The SNMP Exporter makes network-device data available to Prometheus; Node Exporter supplies Linux host metrics such as interface counters. This flexible stack suits teams comfortable with metric queries and configuration. It is not a ready-made network console: you choose exporters, configure scraping, and add dashboards as needed. See the Node Exporter guide and SNMP Exporter project.
Cacti collects values and turns them into graphs. It polls SNMP devices and uses templates for interface charts and historical comparisons. Choose it when graphing is the priority; it is less of an all-in-one alerting platform. See the network graphing guide and poller settings.
Nagios Core runs on Linux and executes plugins to check hosts and services. Add suitable plugins for reachability, application endpoints, or SNMP checks. It is a hands-on option: you assemble checks and configuration, and may add separate graphing. Choose it for explicit status checks rather than automatic topology and traffic charts. Read the Core overview and plugin documentation.
Netdata provides detailed Linux host visibility, including per-interface bandwidth, state, and error metrics. Its broader network monitoring documentation also covers SNMP devices, topology, and flow sources when configured. Start with the network interface guide and network monitoring overview.
Compare 10 ping sweep tools for quick LAN discovery, cross-platform scanning, and IP address management. Learn what a sweep can—and can’t—tell you.
Compare six network management tools for performance monitoring, including SNMP coverage, mapping, alerts, deployment models, and cost tradeoffs.
Compare Wi-Fi analyzer picks for Windows, iPhone, and Android, including tools for channel congestion, signal coverage, heat maps, and network troubleshooting.
Compare seven free, open-source ping monitors, from full network suites to focused latency probes, and choose the right fit for availability, packet loss, and history.
Learn what QoS means in networking, how DSCP markings and traffic queues prioritize voice, video, and business applications, and what QoS cannot fix.
Compare reliable SFTP server software for Windows and Linux, including OpenSSH, Bitvise, SolarWinds, and SFTPGo. Find the right fit for your security and file-transfer needs.
Compare seven IP address manager tools for subnet discovery, DNS and DHCP coordination, network inventory, and open-source IPAM.
Build practical network monitoring with clear device coverage, useful performance metrics, actionable alerts, and a comparison of SolarWinds NPM, PRTG, and OpManager.
Compare network scanner tools for quick device discovery, cross-platform IP scans, and enterprise IPAM, with guidance on matching each option to your network.
Use Nmap’s --traceroute option to map hops to an authorized host, understand hop and RTT output, and troubleshoot missing responses without over-scanning.