10 Best Ping Sweep Tools for Finding Devices on Your Network
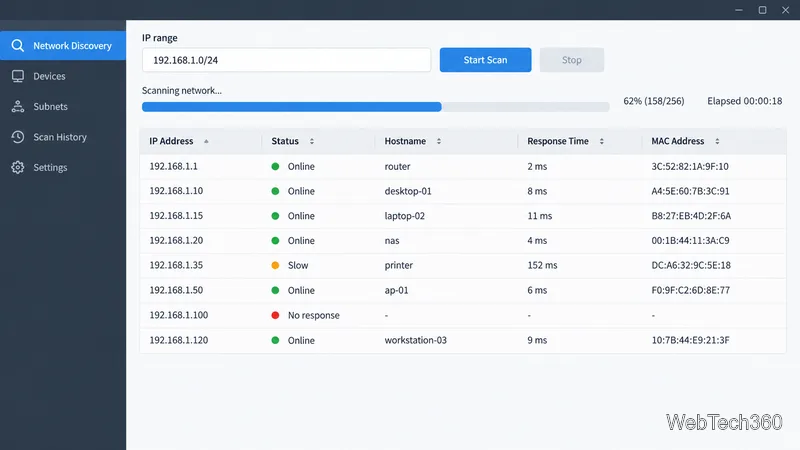
Compare 10 ping sweep tools for quick LAN discovery, cross-platform scanning, and IP address management. Learn what a sweep can—and can’t—tell you.
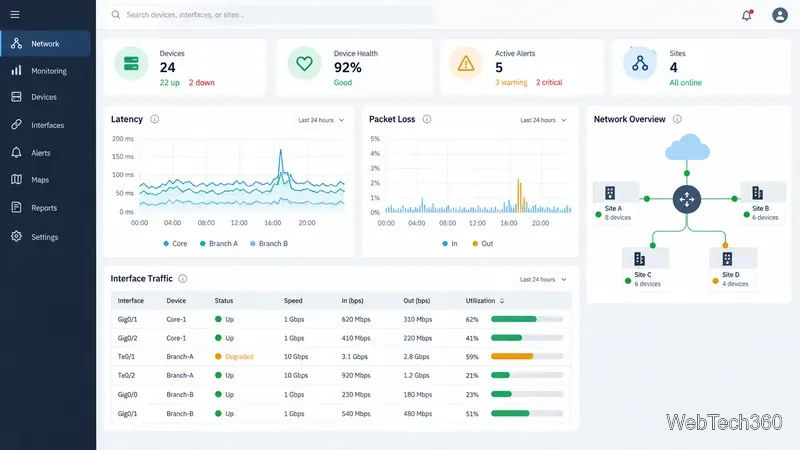
To monitor router traffic, decide whether you need to know how much data crosses each interface or which devices, protocols, or applications use it. SNMP-based monitoring charts interface counters and device health. Flow analysis uses records exported by a compatible router to show traffic sources and patterns.
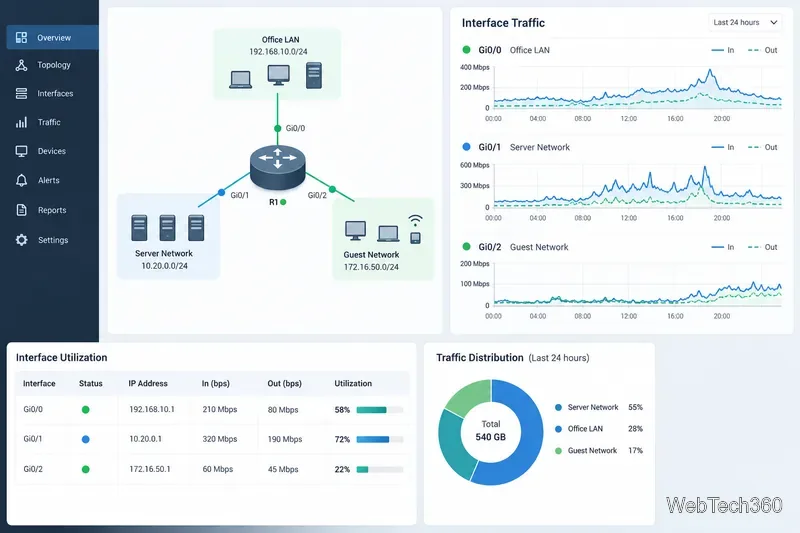
An SNMP monitoring system polls a router’s interface counters and compares readings over time to calculate inbound and outbound rates. The Internet standard IF-MIB defines those interface statistics. The result is useful for spotting a saturated WAN link, errors, or recurring usage peaks, but each reading represents an interval average; a short burst between polls may not appear at its true peak.
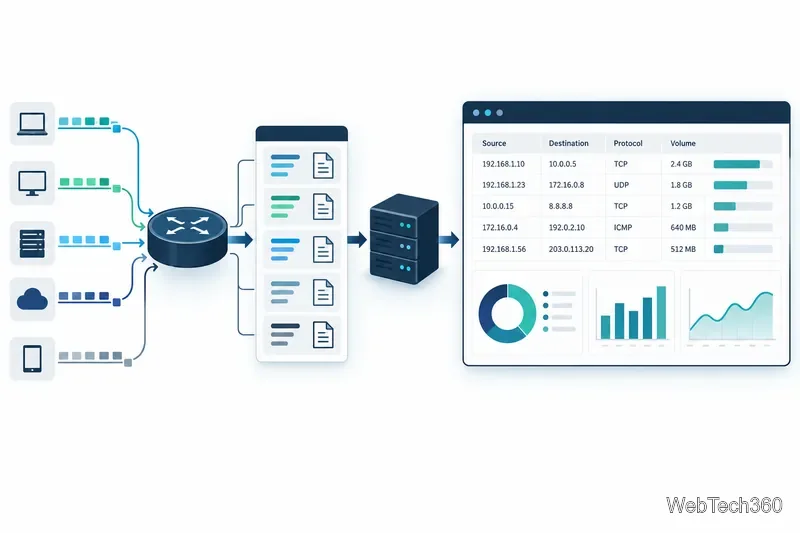
Flow analysis adds context. A router or switch groups traffic into flow records and exports selected fields to a collector. Depending on the device and export template, reports can break usage down by source, destination, protocol, port, or application. Common formats include NetFlow, J-Flow, sFlow, NetStream, and IPFIX. The exact fields vary by vendor, and sampling can make some flow figures estimates. Flow records are not a substitute for full packet capture.
Best for broad network health and interface monitoring. NPM monitors multi-vendor routers and interfaces, with device status, bandwidth, packet loss, and path troubleshooting through NetPath. For flow-level details such as top talkers and applications, SolarWinds pairs it with NetFlow Traffic Analyzer (NTA); NTA requires compatible exporters and devices monitored through NPM. See the NPM overview and NTA protocol and collection details.
Best for a mixed environment monitored from one console. PRTG offers SNMP traffic sensors and flow sensors for NetFlow, jFlow, sFlow, and IPFIX. Flow views can show usage by IP address, protocol, or program when the exporter provides that data. PRTG licensing is sensor-based, so count the sensors your routers and interfaces need before deployment. Its self-hosted Network Monitor has a 100-sensor freeware tier; hosted licensing differs. Check the PRTG flow and SNMP overview and current license guide.
Best for combining router monitoring with wider infrastructure management. OpManager collects SNMP device and interface metrics and supports flow-based traffic monitoring. ManageEngine lists NetFlow, sFlow, jFlow, IPFIX, cFlowd, and NetStream among its supported formats. Confirm the edition and router-specific support in the OpManager monitoring overview.
Best for self-managed, customizable graphs. Cacti is an open-source graphing platform built around RRDtool and commonly uses SNMP to collect device data. It gives administrators control over graph templates and collection, but setup and ongoing maintenance are your responsibility. Start with the Cacti documentation and its network graphing guide.
Best for identifying what is consuming bandwidth in a SolarWinds environment. NTA analyzes flow data by application, protocol, endpoint, conversation, or IP group. Its current documentation lists Cisco NetFlow v5/v9, NBAR2, Juniper J-Flow, sFlow, IPFIX, and Huawei NetStream. Review the NTA feature and compatibility page before enabling exports.
Best for dedicated flow reports and traffic breakdowns. The product provides interface-specific reports with drill-downs for applications, endpoints, conversations, and protocols; it collects NetFlow, sFlow, J-Flow, and other formats. Application names may need mapping, and the reports available depend on fields exported by the router. See ManageEngine’s protocol and application monitoring guide.
Best for flow-focused investigations across larger or distributed networks. Scrutinizer provides flow reports, dashboards, and behavioral analysis for operations and security teams. Its documentation notes that report options depend on the fields present in exporter templates, so verify that your router sends the attributes you need. Review the Scrutinizer overview and flow-reporting documentation.
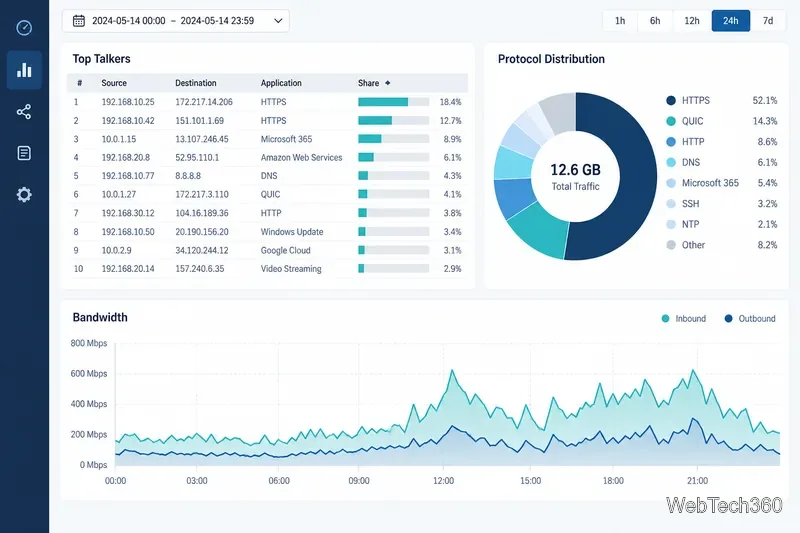
Most router-monitoring tools show usage patterns, not connection contents. Flow data may identify endpoints and protocols, but it generally will not reveal full HTTPS page paths or message contents. For that, use an appropriate endpoint, proxy, or packet-analysis system with the required access and privacy controls.
Compare 10 ping sweep tools for quick LAN discovery, cross-platform scanning, and IP address management. Learn what a sweep can—and can’t—tell you.
Compare six network management tools for performance monitoring, including SNMP coverage, mapping, alerts, deployment models, and cost tradeoffs.
Compare Wi-Fi analyzer picks for Windows, iPhone, and Android, including tools for channel congestion, signal coverage, heat maps, and network troubleshooting.
Compare seven free, open-source ping monitors, from full network suites to focused latency probes, and choose the right fit for availability, packet loss, and history.
Learn what QoS means in networking, how DSCP markings and traffic queues prioritize voice, video, and business applications, and what QoS cannot fix.
Compare reliable SFTP server software for Windows and Linux, including OpenSSH, Bitvise, SolarWinds, and SFTPGo. Find the right fit for your security and file-transfer needs.
Compare seven IP address manager tools for subnet discovery, DNS and DHCP coordination, network inventory, and open-source IPAM.
Build practical network monitoring with clear device coverage, useful performance metrics, actionable alerts, and a comparison of SolarWinds NPM, PRTG, and OpManager.
Compare network scanner tools for quick device discovery, cross-platform IP scans, and enterprise IPAM, with guidance on matching each option to your network.
Use Nmap’s --traceroute option to map hops to an authorized host, understand hop and RTT output, and troubleshoot missing responses without over-scanning.