10 Best Ping Sweep Tools for Finding Devices on Your Network
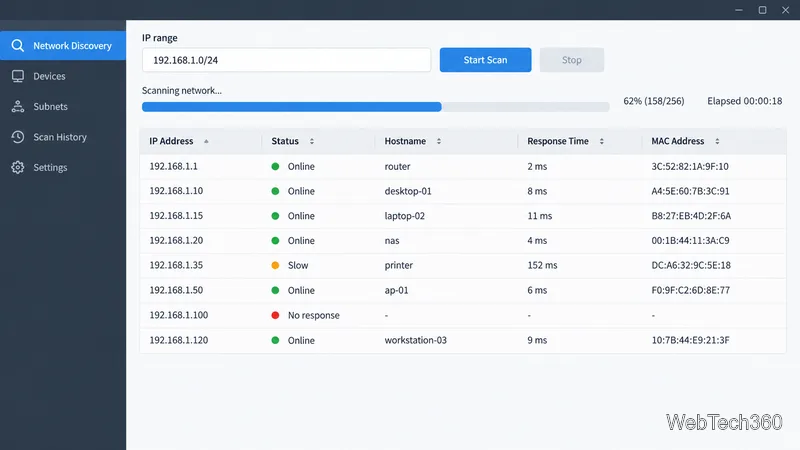
Compare 10 ping sweep tools for quick LAN discovery, cross-platform scanning, and IP address management. Learn what a sweep can—and can’t—tell you.
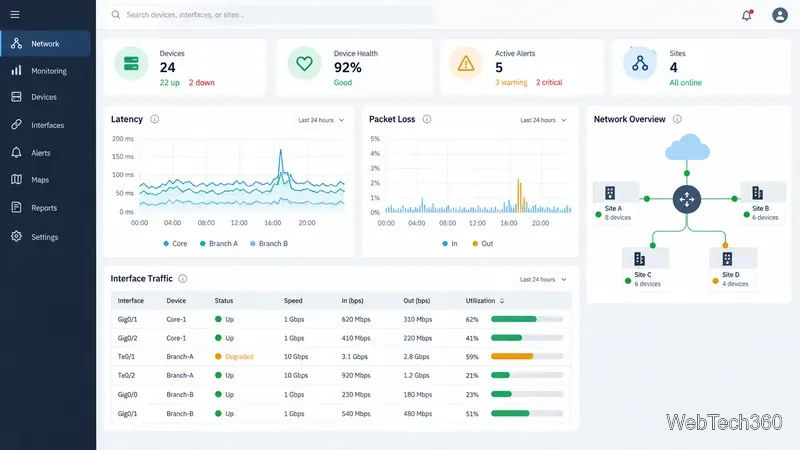
The right performance and load testing tools depend on what you need to measure. A link test, generated WAN traffic, and simulated API users answer different questions. For networks, measure throughput, latency, packet loss, and jitter; for applications, track response time, request rate, and errors as load rises.
Test in a controlled, authorized environment: generated traffic can degrade service. Record the test setup, path, and competing traffic so you can interpret the result.
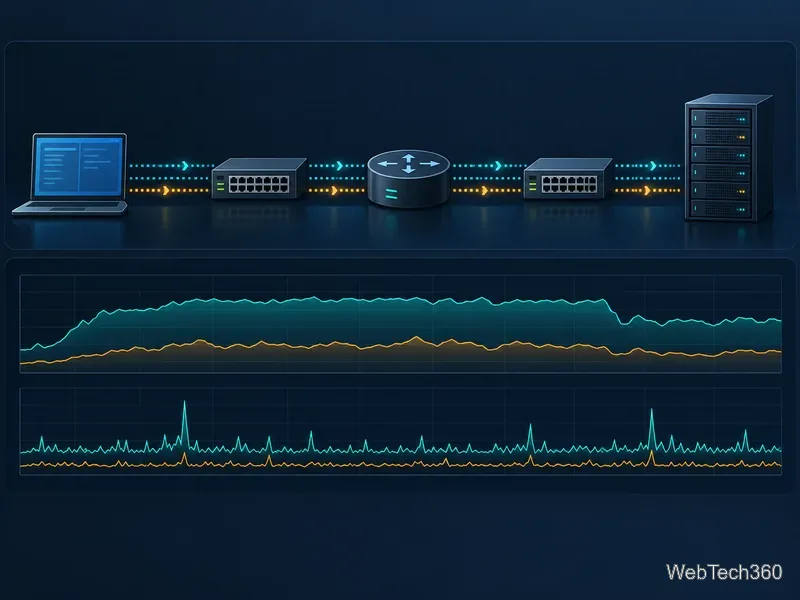
Throughput is delivered data over time; it differs from a link’s rated bandwidth. Latency measures transit or response time, while jitter is variation in packet delay. Traffic generators create load but do not measure application behavior. Web load tools model requests, not raw Ethernet traffic.
iPerf3 is a free command-line tool maintained by ESnet at Lawrence Berkeley National Laboratory. Run a server at one endpoint and a client at the other to measure achievable IP bandwidth. Configure duration, parallel streams, and TCP or UDP; results include throughput and UDP loss. It is a strong first check for a LAN, VPN, or WAN path, but does not model application sessions or disk speed.
LAN Speed Test measures transfers to a shared folder, which makes the result easy to relate to copying files to a NAS. That test includes storage and file-sharing overhead as well as the network. Totusoft also offers LAN Speed Test Server, which can test between computers’ memory to reduce disk bottlenecks. The vendor currently lists version 4.4 for Windows and macOS; its Lite mode is functional, with some advanced features disabled.
WAN Killer, part of SolarWinds Engineer’s Toolset for the Desktop, generates random traffic to a selected target. Set the protocol, port, packet size, circuit bandwidth, and load percentage. It helps test link behavior or traffic prioritization under pressure; use a separate monitor to measure impact. This Windows component is not an end-to-end user test.
Ostinato provides a graphical controller and traffic-generator agents for building multiple Layer 2 and Layer 3 streams, replaying packet captures, and varying send rates. It is useful for validating network devices, protocol handling, and custom traffic mixes. Its feature set varies by license, and the vendor notes that stateful TCP connections are not supported, so use another tool when your test depends on realistic TCP application sessions.
Cisco TRex is an open-source, DPDK-based traffic generator with stateless and stateful modes. It targets engineers testing routers, firewalls, and other network equipment with high-volume profiles. Setup is more involved than with a throughput utility, so TRex fits a dedicated lab with compatible hardware and a defined test plan.

Apache JMeter is an open-source test application for web, API, database, messaging, and other services. Its test plans can model requests, data, assertions, and user concurrency. JMeter works at the protocol level; it does not execute JavaScript like a browser. Apache recommends running load tests in command-line mode rather than driving a heavy test from the GUI, then reviewing the generated results.
Grafana k6 is a code-first performance testing tool whose JavaScript-based scripts define requests, scenarios, and thresholds. Scenarios model different load patterns, while thresholds turn metrics such as request duration into pass/fail criteria that can run in CI. Choose k6 when test plans belong alongside application code and you want repeatable checks. Validate that the script represents real user behavior before treating its results as a production forecast.
Wireshark captures and analyzes packets; it does not generate load or provide a standalone benchmark. Pair it with iPerf3, a traffic generator, or an application test to inspect retransmissions, protocol exchanges, and packet timing. Capture filters limit what is recorded, while display filters narrow what you see after capture. Choose the right network interface and capture point, and remember that you may need elevated privileges for live capture.
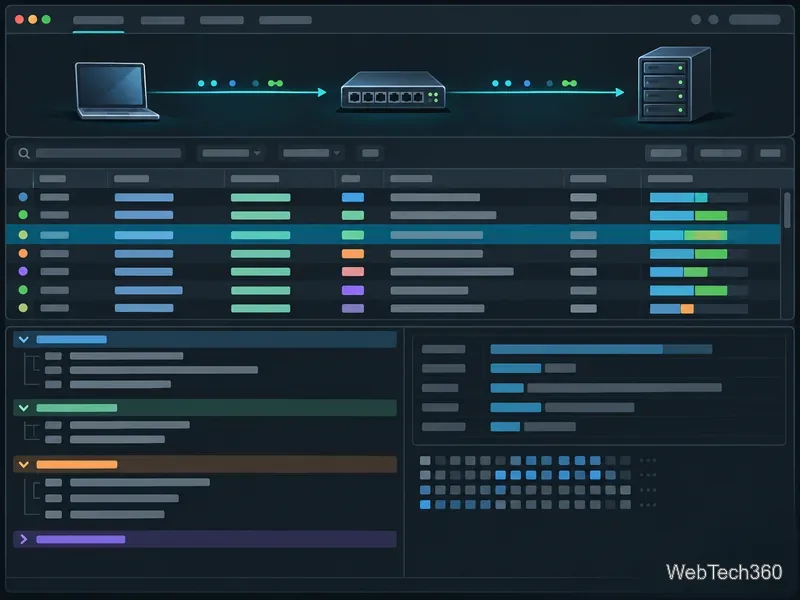
For comparable results, record endpoints, duration, protocol, and concurrent traffic. Repeat the same scenario after a change, while monitoring for network, server, storage, or client saturation.
Compare 10 ping sweep tools for quick LAN discovery, cross-platform scanning, and IP address management. Learn what a sweep can—and can’t—tell you.
Compare six network management tools for performance monitoring, including SNMP coverage, mapping, alerts, deployment models, and cost tradeoffs.
Compare Wi-Fi analyzer picks for Windows, iPhone, and Android, including tools for channel congestion, signal coverage, heat maps, and network troubleshooting.
Compare seven free, open-source ping monitors, from full network suites to focused latency probes, and choose the right fit for availability, packet loss, and history.
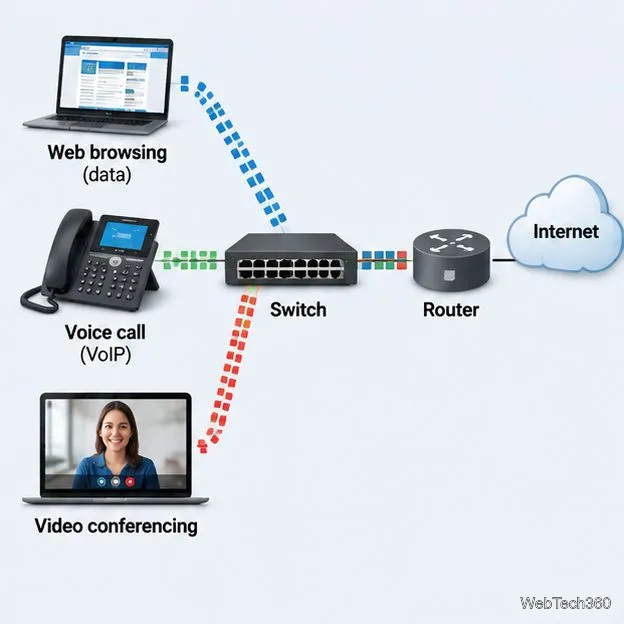
Learn what QoS means in networking, how DSCP markings and traffic queues prioritize voice, video, and business applications, and what QoS cannot fix.
Compare reliable SFTP server software for Windows and Linux, including OpenSSH, Bitvise, SolarWinds, and SFTPGo. Find the right fit for your security and file-transfer needs.
Compare seven IP address manager tools for subnet discovery, DNS and DHCP coordination, network inventory, and open-source IPAM.
Build practical network monitoring with clear device coverage, useful performance metrics, actionable alerts, and a comparison of SolarWinds NPM, PRTG, and OpManager.
Compare network scanner tools for quick device discovery, cross-platform IP scans, and enterprise IPAM, with guidance on matching each option to your network.
Use Nmap’s --traceroute option to map hops to an authorized host, understand hop and RTT output, and troubleshoot missing responses without over-scanning.