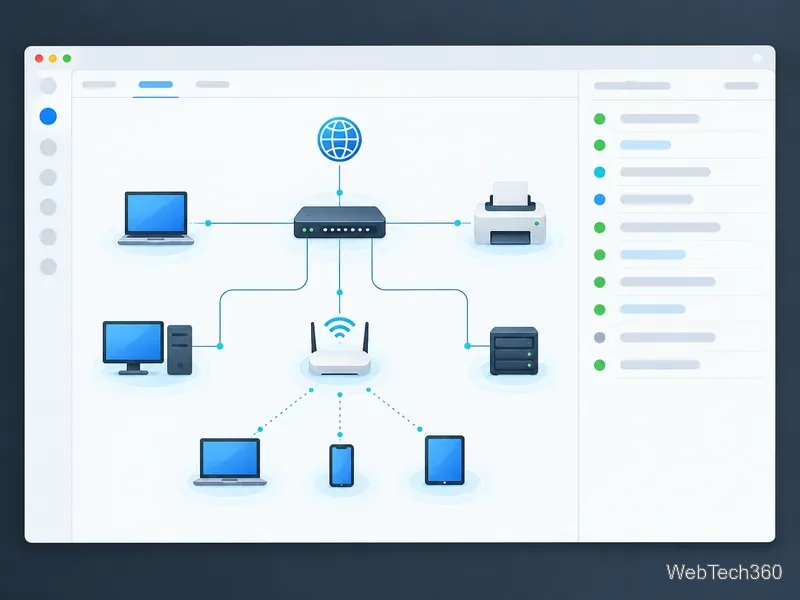
10 Best Ping Sweep Tools for Finding Devices on Your Network
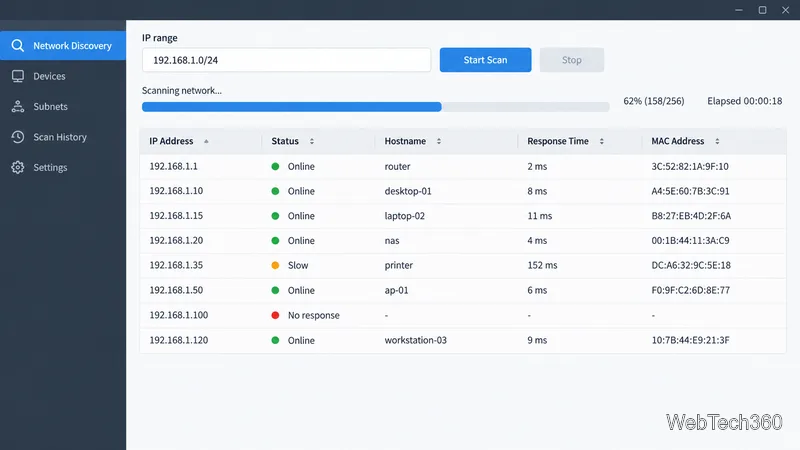
Compare 10 ping sweep tools for quick LAN discovery, cross-platform scanning, and IP address management. Learn what a sweep can—and can’t—tell you.
Bandwidth is the data-carrying capacity of a network link or path; throughput is the rate at which data actually gets through during a particular test or period. A connection advertised at a given rate does not guarantee that same application transfer rate: competing traffic, protocol overhead, packet loss, wireless conditions, and the devices at either end can all reduce the result.
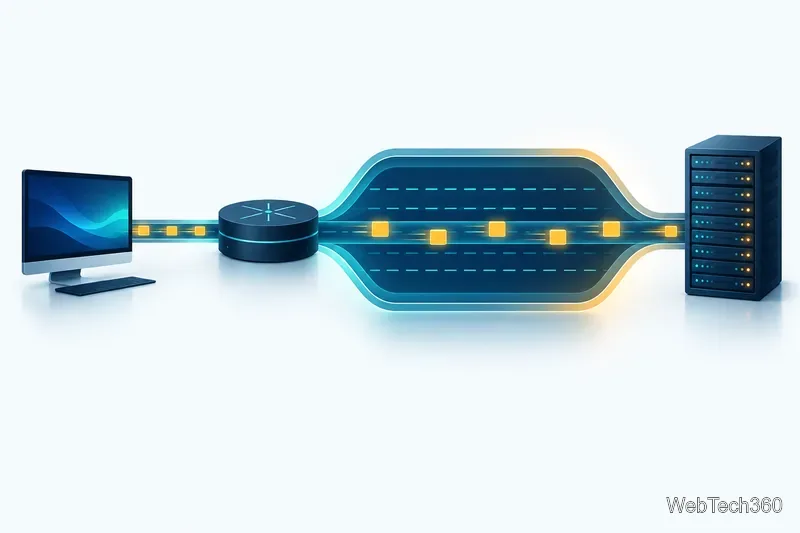
In everyday conversation, bandwidth often means the maximum rate in an internet plan or the rated speed of a link. The network path may include several links, however, and the segment with the least available capacity can limit the whole transfer. Other users may also share that capacity. The IETF distinguishes a network’s capacity from its observed usage and available capacity in its definitions of network capacity.
Throughput is a measured data rate between chosen endpoints, in a specified direction and time interval. A test result therefore describes that path and those conditions, not every connection on the network. Goodput is narrower: it counts useful application data, excluding headers and retransmitted bytes. Goodput is usually lower than the rate seen at the link or IP layer. Rates may appear as megabits per second (Mbps) or megabytes per second (MB/s); one byte contains eight bits, so check the unit before comparing numbers.
| Factor | Effect |
|---|---|
| Bottlenecks and congestion | A slower link, oversubscribed uplink, or busy shared channel can cap throughput. Queueing during busy periods can also add delay. |
| Latency and round-trip time | Latency is packet travel delay; round-trip time (RTT) includes the trip there and back. Longer RTT can limit a TCP transfer when the sender cannot keep enough data in flight, even if the link has spare capacity. Distance sets a propagation floor, while queues and processing add variable delay. |
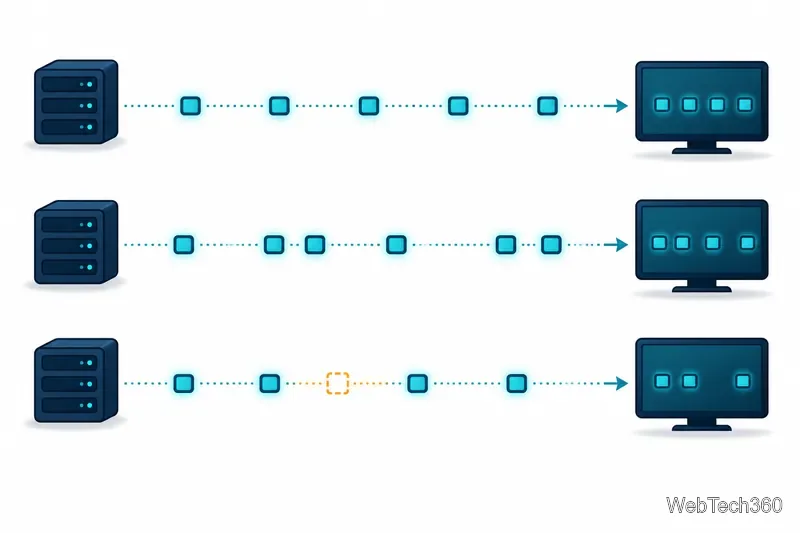
| Jitter and packet loss | Jitter is commonly used for variation in packet delay (the IETF’s more precise term is packet delay variation). Uneven arrivals can disrupt voice or video. Lost TCP packets are retransmitted, consuming time and capacity; real-time UDP traffic may instead arrive with gaps. |
| Wi-Fi, devices, and configuration | Interference, weak signal, shared airtime, router or NIC limits, CPU load, VPN encryption, and mismatched path MTU or TCP buffers can constrain a test or real transfer. |
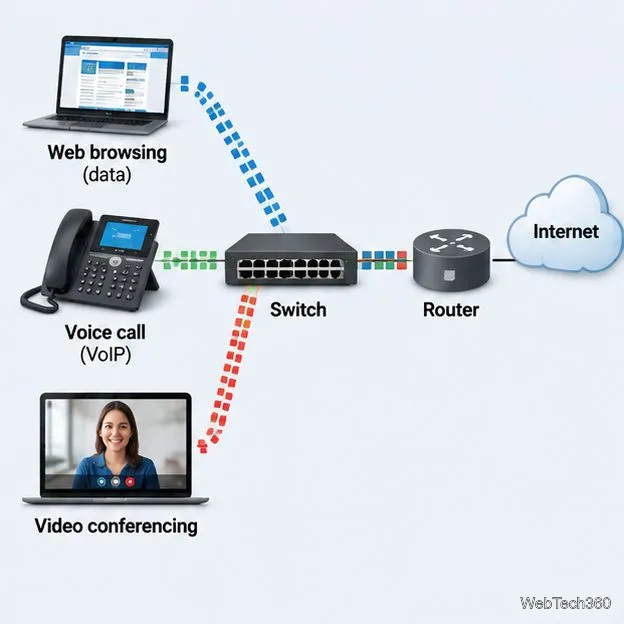
Throughput and user experience are related but not interchangeable. A large file download can finish well on a high-throughput path with modest delay; a video call can still feel poor when delay varies or packets are lost. The IETF’s packet delay variation metric explains why arrival-time variation matters to applications that need regularly spaced packets.
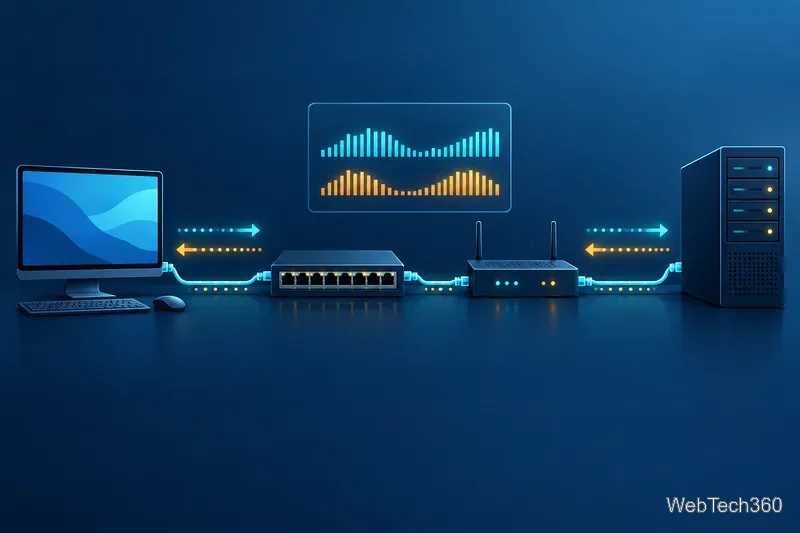
The most useful comparison is like for like: same endpoints, same direction, same protocol, and similar test conditions. That makes the result a diagnostic clue rather than a misleading comparison between a plan’s rated bandwidth and a single throughput sample.
Compare 10 ping sweep tools for quick LAN discovery, cross-platform scanning, and IP address management. Learn what a sweep can—and can’t—tell you.
Compare six network management tools for performance monitoring, including SNMP coverage, mapping, alerts, deployment models, and cost tradeoffs.
Compare Wi-Fi analyzer picks for Windows, iPhone, and Android, including tools for channel congestion, signal coverage, heat maps, and network troubleshooting.
Compare seven free, open-source ping monitors, from full network suites to focused latency probes, and choose the right fit for availability, packet loss, and history.
Learn what QoS means in networking, how DSCP markings and traffic queues prioritize voice, video, and business applications, and what QoS cannot fix.
Compare reliable SFTP server software for Windows and Linux, including OpenSSH, Bitvise, SolarWinds, and SFTPGo. Find the right fit for your security and file-transfer needs.
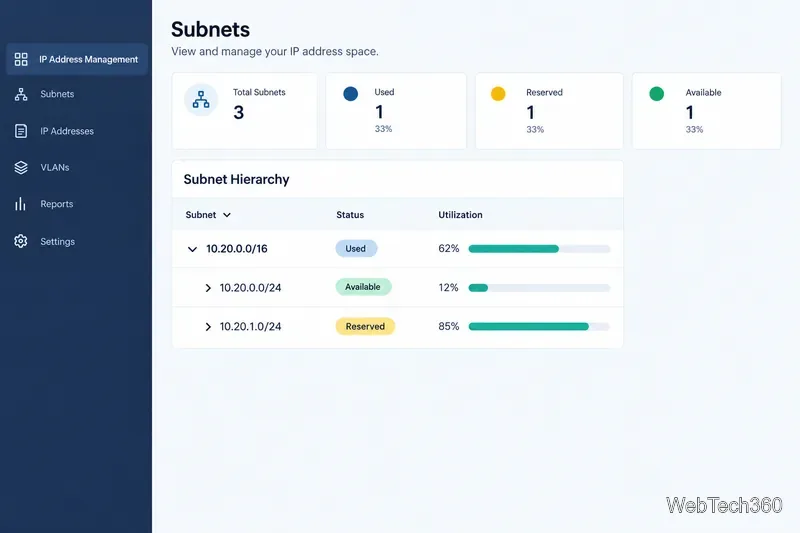
Compare seven IP address manager tools for subnet discovery, DNS and DHCP coordination, network inventory, and open-source IPAM.
Build practical network monitoring with clear device coverage, useful performance metrics, actionable alerts, and a comparison of SolarWinds NPM, PRTG, and OpManager.
Compare network scanner tools for quick device discovery, cross-platform IP scans, and enterprise IPAM, with guidance on matching each option to your network.
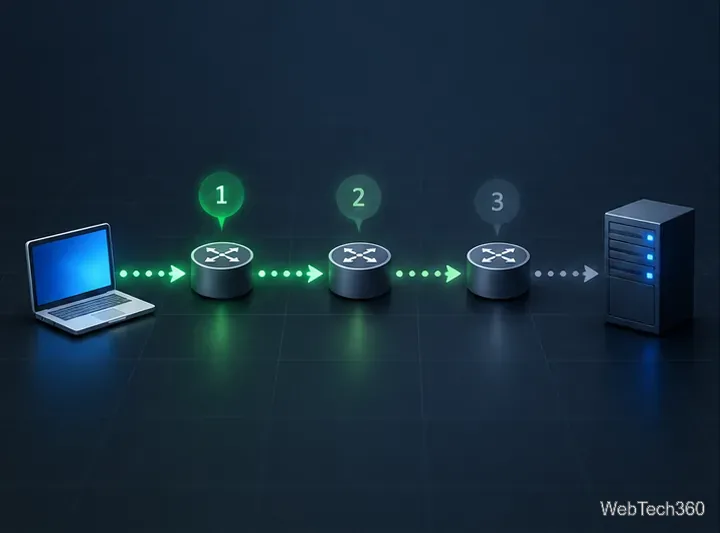
Use Nmap’s --traceroute option to map hops to an authorized host, understand hop and RTT output, and troubleshoot missing responses without over-scanning.